Since 2009, Google has been lauded for publishing “transparency reports” on government requests to take information offline. Each time a government official asks for a search result to be blocked or a YouTube video to be removed, Google marks down the request and discloses the number of such takedowns each nation has asked for every six months or so.
While a worthy cause for transparency advocates, the reports make for dry reading — which is why designer Sebastian Sadowski recently created a visualization of all Google’s transparency reports from 2010 to 2012 for 55 nations.
The most obvious trend revealed by Sadowski’s visualization: around the world, requests for censorship are increasing. Globally, Google has received 7,047 takedown requests during the 2.5-year period beginning in July 2010. However, 2,285, or nearly a third, of those takedown requests occurred during the last six months of 2012.

Despite the controversy in the United States surrounding the removal of copyrighted work from the Internet, copyright offenses make up only a small part of what the U.S. asks Google to censor. The majority of takedown requests, according to the visualization, are for reasons of “defamation.”
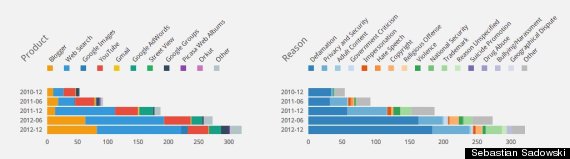
US Take-down requests
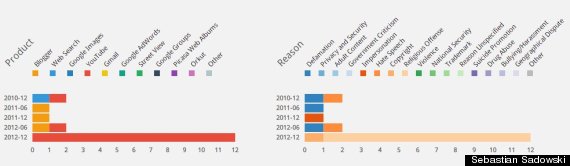
Malaysian Take-down requets
See the full range of charts and data as well as see the Full Article: Source – Huffington Post
http://www.huffingtonpost.com/2013/07/03/government-censor-internet_n_3535322.html

Leave a Reply
You must be logged in to post a comment.